It’s easy to characterise the seismic response of the reservoir where there’s good well control. It’s another matter to do so far away from the wells – exactly where the geatest interest is, of course.
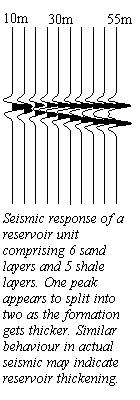
Interpreting the appearance of a seismic section is complicated by the fact that many reservoirs are too thin to be fully resolved by the seismic. Typical sampling intervals mean formations less than 20m or 30m in thickness may not show up at all, or their appearance may be greatly altered by tuning effects or interferences between downgoing and upgoing waves. If the seismic response of a play is enhanced away from the well control, does it mean the formation is thicker? Or could it actually be thinner, but with its seismic amplitude enhanced by some tuning effect? Or could the change in signal indicate facies change? More shale? Less shale? Or pore fluid changes?
The possibilities seem infinite, the answers unknowable. This is where the skill and intuition of the interpreter comes into play. An experienced interpreter will know from long familiarity what a particular seismic signature says about the subsurface geology.
But even the most experienced old hand hasn’t seen every possible combination of factors affecting the appearance of the seismic signal. Far too often they must guess, or extrapolate from previous work in different areas. tune3D is the tool to take away the guesswork, put the extrapolations on a solid footing…
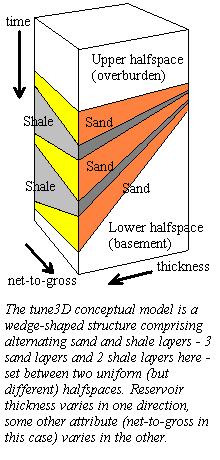
Straightforward and easy to use, tune3D is a powerful tool in any interpreter’s armoury. Simple in principle but surprisingly profound in practice, the program computes the seismic response of a 3-D wedge structure set between two homogeneous halfspaces. The wedge comprises a number of alternating sand and shale layers, varying in thickness in one direction and in some other attribute – net-to-gross or incidence angle in the current version but with other attributes planned – in the other.
In order to approximate an anolog response to a continuous Earth, the synthetic seismic traces are computed at a very fine sample interval – the actual sample interval is user-selectable, but a figure of 100 microseconds is reasonable. Wavelet bandwidth remains the same as for the (coarsely sampled) field seismic, so seismic character is realistic and directly comparable with the actual seismic from the field, but the supersampling ensures fine detail within the reservoir model is rendered correctly.
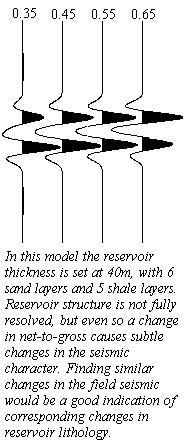
The model isn’t, of course, supposed to correspond to any geological reality. Rather, the output seismic volume illustrates the variations to be expected in the seismic signal arising from subtle variations within the reservoir. By comparing the trace-to-trace changes seen in the actual seismic with the output from tune3D in net-to-gross mode the skilled interpreter can infer changes in lithology and overall reservoir structure that might otherwise be hard to spot.
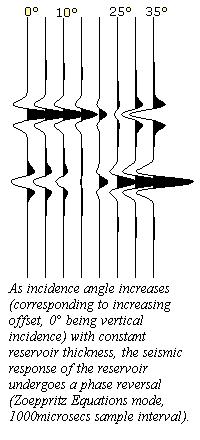
The incidence angle mode is an equally powerful aid for AVO studies. It uses the full Zoeppritz Equations to estimate the effects of non-vertical incidence on reflection amplitude and phase. Increasing incidence angle corresponds, of course, to increasing offset so the computed seismic traces are a guide to the kind of changes to be expected in the signal amplitude and phase as offset varies. In particular, subtle phase reversals are a feature of AVO work and tune3D is able to predict them.
The output from tune3D is a tuning file, containing the times of the maxima and minima for each trace, together with three SEG-Y files, one each for the acoustic impedance series, the reflection coefficient series derived from the AI and the synthetic seismic volume.